Hông-Lan Botterman, Robin Lamarche-Perrin
In Computational Social Network, 8 (15), 2021
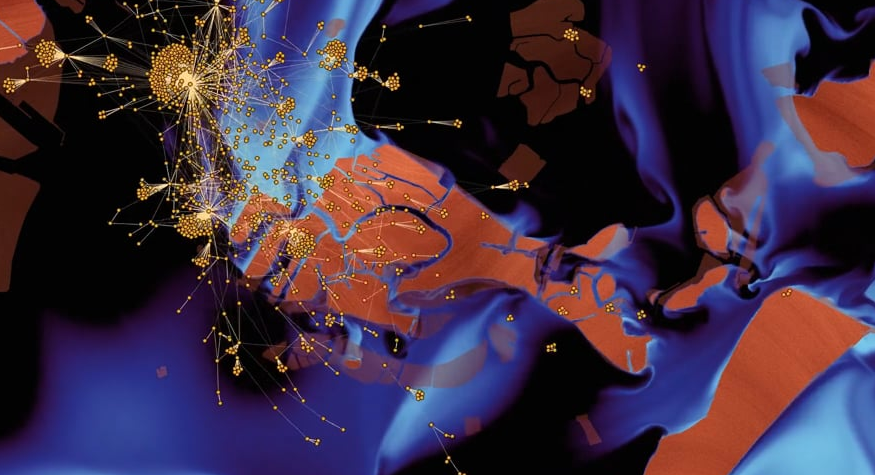
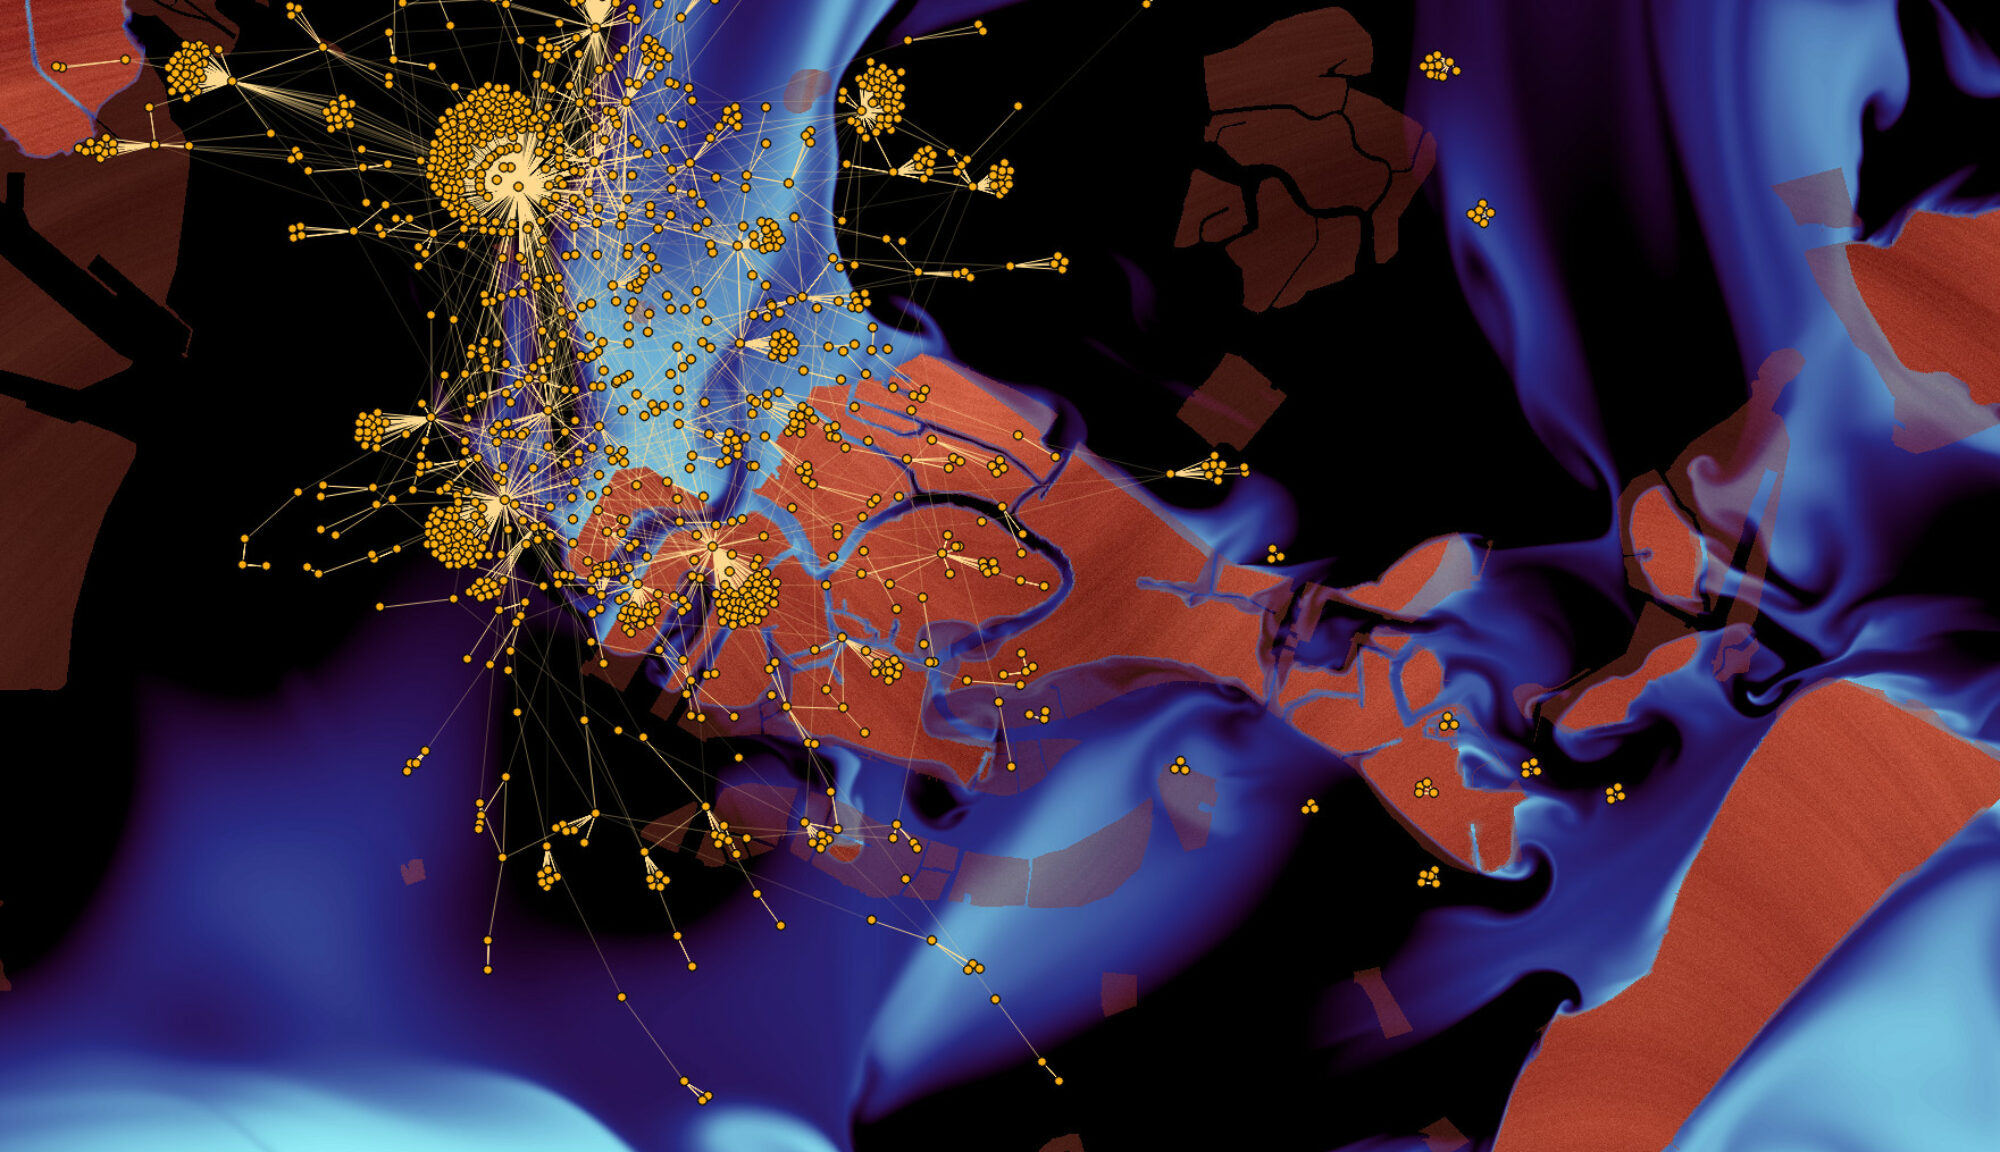
Socio-technical systems usually consists of many intertwined networks, each connecting different types of objects (or actors) through a variety of means. As these networks are co-dependent, one can take advantage of this entangled structure to study interaction patterns in a particular network from the information provided by other related networks. A method is hence proposed and tested to recover the weights of missing or unobserved links in heterogeneous information networks (HIN) – abstract representations of systems composed of multiple types of entities and their relations. Given a pair of nodes in a HIN, this work aims at recovering the exact weight of the incident link to these two nodes, knowing some other links present in the HIN. To do so, probability distributions resulting from path-constrained random walks i.e., random walks where the walker is forced to follow only a specific sequence of node types and edge types, capable to capture specific semantics and commonly called a meta-path, are combined in a linearly fashion in order to approximate the desired result. This method is general enough to compute the link weight between any types of nodes. Experiments on Twitter and bibliographic data show the applicability of the method.