Daniel Archambault
May 27th, 11h Room 24-25-405. UPMC – Sorbonne Université. 4 Place de Jussieu, 75005 Paris.
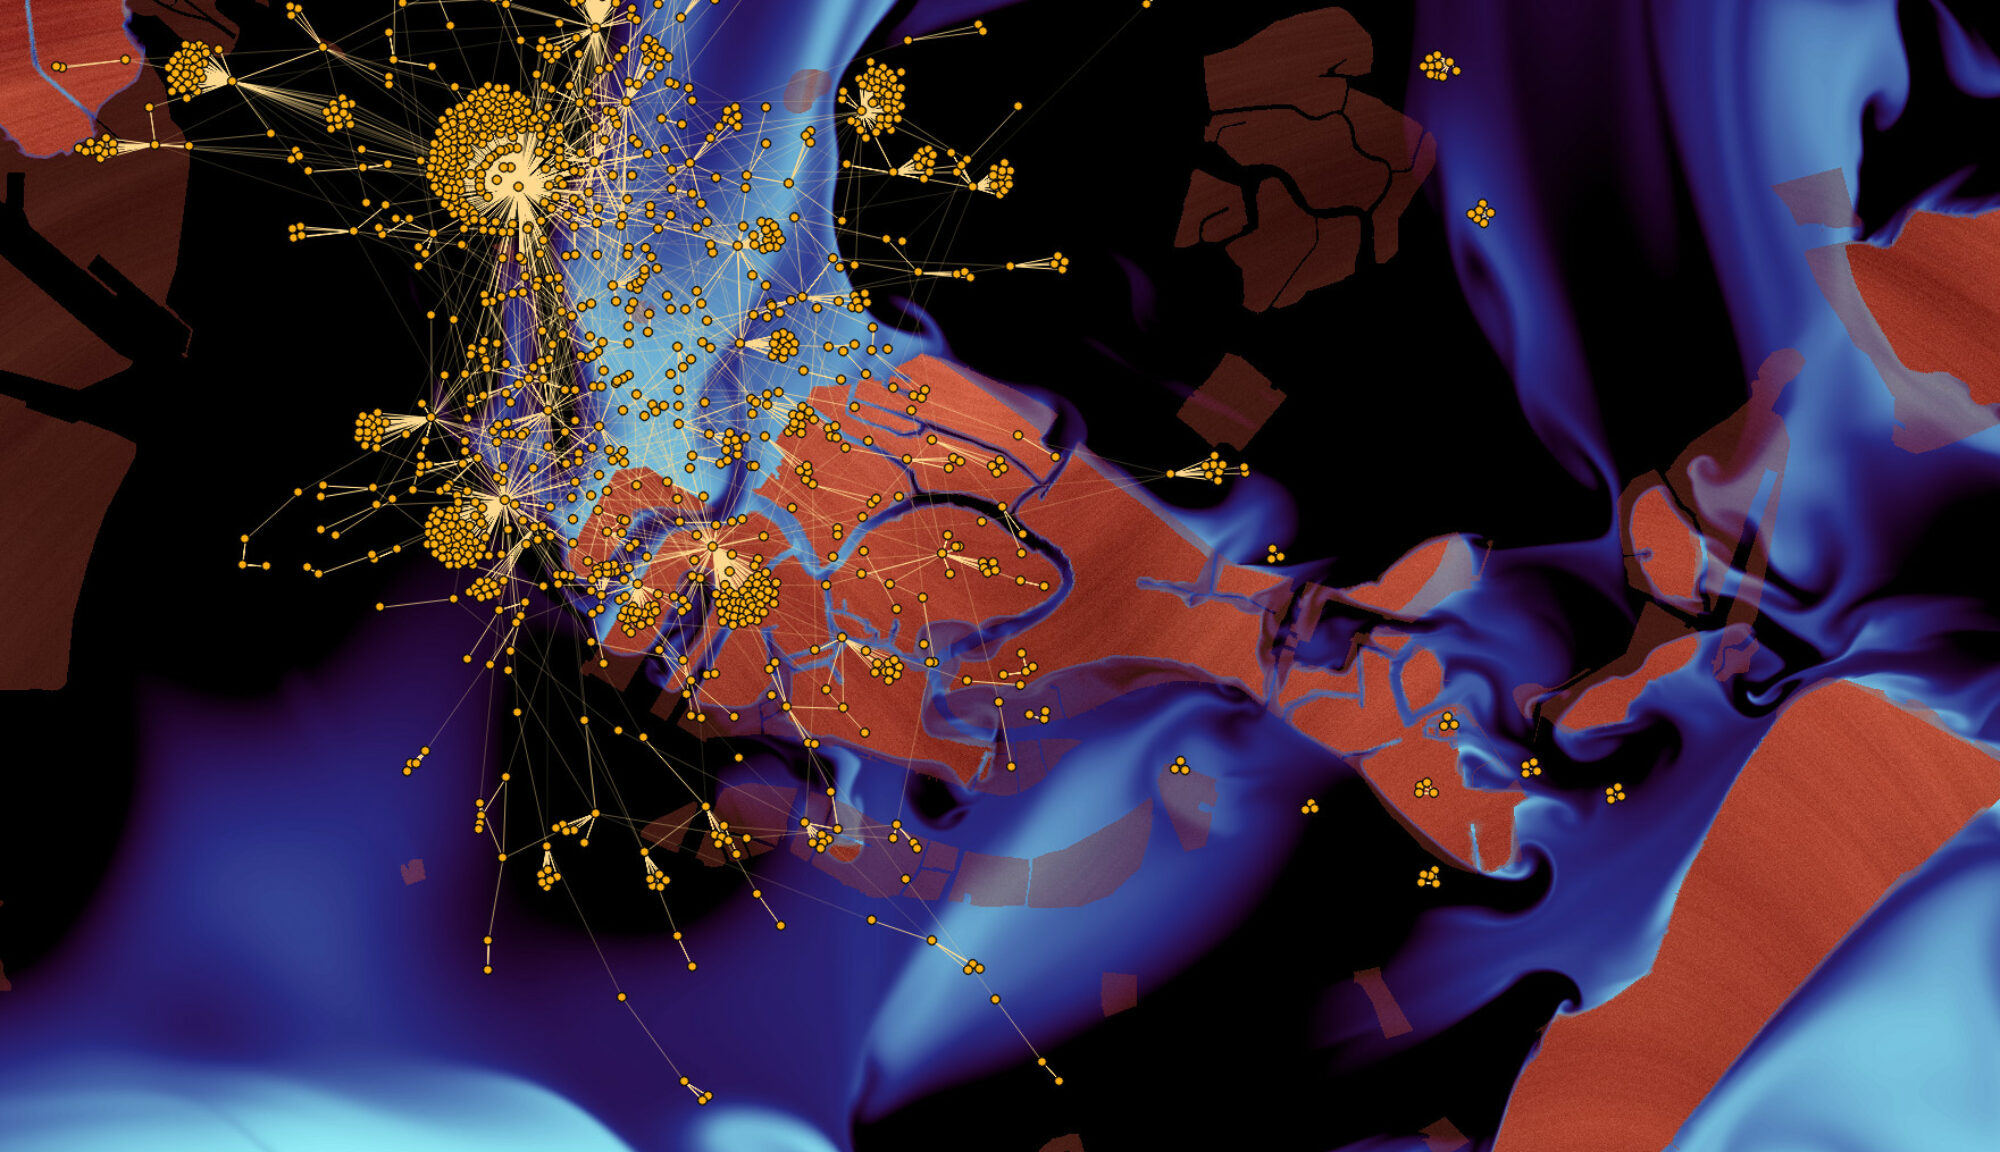
One of the most important types of data in data science is the graph or network. Networks encode relationships between entities: people in social network, genes in biological network, and many others forms of data. These networks are often dynamic and consist of a set of events — edges/nodes with individual timestamps. In the complex network literature, these networks are often referred to as temporal networks. As an example, a post to a social media service creates an edge existing at a specific time and a series of posts is a series of such events. However, the majority of dynamic graph visualisations use the timeslice, a series of snapshots of the network at given times, as a basis for visualisation. In this talk, I present two recent approaches for event-based network visualisation: DynNoSlice and the Plaid. DynNoSlice is a method for embedding these networks directly in the 2D+t space-time cube along with methods to explore the contents of the cube. The Plaid is an interactive system for visualising long in time dynamic networks and interaction provenance through interactive timeslicing.
